Archive | Industry RSS feed for this section

Business Framework for Analytics Implementation

14 Sep

Updated 9/14/20 with new links. It is a bit ironic that I linked to the Dataversity site, and they do not use persistent identifiers to label their data assets, so all my links are dead. Note to practitioners – if you are not using persistent identifiers your institutional knowledge captured in data assets lasts as long as the identifier!

I went looking for this deck as I was having a discussion on governance that is as old as the hills; essentially how do you link data governance activities to the business activity to address – why does data governance exist?

The other discussion that got me looking at this article again was how we go about building an operating model for organizations where the Governance team is doing more than responding to quality requests – how does the team proactively address data issues?

Both of these are tied to the article below. The Hoshin Framework (at least as it is presented below) ties strategic initiatives all the way down to identified data capabilities that can be addressed proactively to support the business strategy. 

A note on the spreadsheet. This spreadsheet is not for the faint of heart. The spreadsheet supports the thought exercise used to shape discussions and your communication with stakeholders. The key point to take away is that the spreadsheet gives you the ability to relate governance budget to strategic goals, funded programs, current project and metrics. Think of it as the audit worksheets – no one ever sees those, and the auditor reports out only the results.

Original Post.

In my previous post I discussed some analytical phrases that are gaining traction. Related to that I have had a number of requests for the deck that I presented at the Enterprise Dataversity  – Data Strategy & Analytics Forum.  I have attached the presentation here. NOTE: This presentation was done a few years ago while I was with CMMI (Now ISACA) as a result it is tied to their Data Management Maturity Model. I talked about analytics, and my colleague on the presentation addressed data maturity.

Also, while I am posting useful things that people keep asking for, here are a set of links that Jeff Gentry did on management frameworks for a Dataversity Webinar. Of particular interest to me was the mapping of the Hoshin Strategic Planning Framework to the CMMI Data Management Maturity Framework. The last link is the actual excel spreadsheet template.

Links:

  1. Webinar Recording: http://www.dataversity.net/cdo-webinar-cdo-interview-with-jeff-gentry-favorite-frameworks/. Here is link to deck.
  2. Link to Using Hoshin Frameworks. Hoshin is bigger than just this matrix, and is a heavy process for most people. However, the following gives you soem background: http://www.slideshare.net/Lightconsulting/hoshin-planning-presentation-7336617
  3. Hoshin Framework linked to DMM: Data Analytics Strategy and Roadmap Template 20160204D.xlsx

Data Prep – More than a Buzzword?

25 Feb

“Data Prep” has become a popular phrase over the last year or so – why? At a practical level, data preparation tools are providing the same functionality that traditional ETL (extract, transform, load) tools provide. Are data prep tools just a marketing gimmick to get organizations to buy more ETL software? This blog seeks to address why data prep capabilities have become a topic of conversation within the data and analytics communities.

Traditionally, data prep has been viewed as slow and laborious, often associated with linear, rigid methodologies. Recently, however, data prep has become synonymous with data agility. It is a set of capabilities that pushes the boundaries of who has access to data, and how they can apply it to business challenges. Looked at this way, data prep is a foundational capability for digital transformation, which I define as the ability of companies to evolve in an agile fashion in some key dimension of their business model. The business driver of most transformation programs is to fundamentally change key business performance metrics, such as revenue, margins, or market share. Viewed in this way, data prep tools are a critical addition to the toolbox when it comes to driving key business metrics.

Consider the way that data usage has evolved, and the role that data prep capabilities are playing.

Analytics is maturing. Analytics is not a new idea. However, for years it was a function relegated to Operations Research (OR) folks and statisticians. This is no longer the case. As BI and reporting tools grew more powerful and increasingly enabled self service for end users, users began asking questions that were more analytical in nature.

Data-Driven decisions require data “in context.” Decision-making and the process that supports it require data to be evaluated in the context of the business or operational challenge at hand. How management perceives an issue will drive what data is collected and how it is analyzed. In the 1950’s and 1960’s, operations research drove analytics, and the key performance indicators were well established. These included time in process, mean time to failure, yield and throughput. All of these were well understood and largely prescriptive. Fast forward to now. Analytics is broadly applied and used well beyond the scope of operations research. New types of analysis driven in large part by social media trends are much less prescriptive and value is driven by context. Examples include: key opinion leader, fraud networks, perceptual mapping, and sentiment analysis.

Big data is driving the adoption of machine learning. Machine learning requires the integration of domain expertise with the data in order to expose “features” within the data that enhance the effectiveness of machine learning algorithms. The activity that identifies and organizes these features is called “feature engineering.” Many data scientists would not equate “data preparation” with feature engineering, yet there is a strong correlation to what an analyst does. A business analyst invariably creates features as they prepare their data for analysis: 1) observations are placed on a time line; 2) revenue is totaled by quarters and year; 3) customers are organized by location, by cumulative spend, and so on. Data Prep in this context is the organization of data around domain expertise, and is a critical input to the harnessing of big data through automation.

Data science is evolving and data engineering is now a thing. Data engineering focuses on how to apply and scale the insights from data science into an operational context. It’s one thing for a data scientist to spend time organizing data for modest initiatives or limited analysis, but for scaled up operational activities involving business analysts, marketers and operational staff, data prep must be a capability that is available to staff with a more generalized skill set. Data engineering supports building capabilities that enable users to access, prepare and apply data in their day-to-day lives.

“Data Prep” in the context of the above is enabling a broader community of data citizens to discover, access, organize and integrate data into these diverse scenarios. This broad access to data using tools that organize and visualize is a critical success factor for organizations seeking the business benefits of digitally enabling their organization. Future blogs will drill down on each of the above to explore how practitioners can evolve their data prep capabilities and apply them to business challenges.

Architecting the Framework for Compliance & Risk Management

24 Oct

Really quick visit to the Data Architecture Summit this year. I wish I could have stayed longer, but I had to get back to a project.

My presentation was on creating audit defensibility that ensures practices are compliant and performed in a way that is scalable, transparent, and defensible; thus creating “Audit Resilience.” Data practitioners often struggle with viewing the world from the auditor’s perspective. This presentation focused on how to create the foundational governance framework supporting a data control model required to produce clean audit findings. These capabilities are critical in a world where due diligence and compliance with best practices are critical in addressing the impacts of security and privacy breaches.

Here is the deck. This was billed as an intermediate presentation and we had a mixed group of business folks and IT people with good questions and dialogue. I am looking forward to the next event.

Enterprise Data Worlds

22 May

I attended the Enterprise Data Worlds conference last month in San Diego. I was speaking on GDPR, and what you needed to do if you were just starting to think about GDPR  as the deadline is now so close. The meeting was well attended which was a surprise given how close we are to the deadline. The Facebook / Cambridge Analytica fiasco has drawn attention to the protection of personal information, and to GDPR in particular. What I see are the smaller companies getting drawn into the discussion, and realizing how big this might be for them. The deck is below.

In general, the show continues to improve. The keynote presentation by Mike Ferguson. Intelligent Business Strategies Ltd  Was interesting in that I am not sure if the same presentation had been given a couple of years ago that it would have been as well received. It would have been considered a fantasy by so many in the audience. Some of his key points:

  • Very comprehensive at the enterprise level – remember when Enterprise data management – or enterprise anything was a bad word?!
  • Tagging and classification is all going to be algorithm driven, and in the pipe – In his presentation IOT was driving the volume – had some good volume numbers.
  • Pushing the virtual enterprise data lake – everything tied together in a metadata hub

The products and vendor knowledge was the biggest surprise of the show – probably because expectations were low. In general, the tools discussions were more applied. Key observations:

  • Much more evolved presentations – hooked to business drivers.
  • Integrated products on the rise. Especially around the source to target discussion:
    • ETL, DQ, Profiling and Remediation are integrated into a single pipeline discussion
    • Sales people were more knowledgeable about how this works.
    • API injection of new capabilities into this pipeline – this was something that all professed to do. However, when pushed it was clear that there were varying stages of capability – All seemed to have APIs, the question seemed to be about how robust the API is.
    • Linked data / semantics was a bigger topic than normal. It is beginning to be discussed in an applied sense.
    • The FIBO (Financial Business Ontology) is a driver in this – more importantly it is being integrated into tools – so people can visualize how it is applied. This is pulling in the business side of the house
    • This is all metadata especially business metadata – this is shifting the discussion towards business.

Health Data Analytics 2016 — Martin’s Insights

29 Nov

I captured this write up by Martin Fowler as it is organized around 6 areas that I see as foundational: collection/persistence; privacy / security; interoperability / sharing; BI / Reporting;  analytics; and, Information strategy. It always seems in one form or another to come back to these topics.

From http://www.martinsights.com

Health Data Analytics 2016

I had the privilege and pleasure to attend HISA’s Health Data Analytics conference in Brisbane on 11 and 12 October 2016. What follows is this particular BI and Analytics consultant’s impressions and insights from the conference in terms of the main themes covered and the messages and impressions I take away, again from my particular…

via Health Data Analytics 2016 — Martin’s Insights

Business Framework for Analytics Implementation

3 Aug

Updated 9/14/20 with new links. It is a bit ironic that I linked to the Dataversity site, and they do not use persistent identifiers to label their data assets, so all my links are dead. Note to practitioners – if you are not using persistent identifiers your institutional knowledge captured in data assets lasts as long as the identifier!

I went looking for this deck as I was having a discussion on governance that is as old as the hills; essentially how do you link data governance activities to the business activity to address – why does data governance exist?

The other discussion that got me looking at this article again was how we go about building an operating model for organizations where the Governance team is doing more than responding to quality requests – how does the team proactively address data issues?

Both of these are tied to the article below. The Hoshin Framework (at least as it is presented below) ties strategic initiatives all the way down to identified data capabilities that can be addressed proactively to support the business strategy. 

A note on the spreadsheet. This spreadsheet is not for the faint of heart. The spreadsheet supports the thought exercise used to shape discussions and your communication with stakeholders. The key point to take away is that the spreadsheet gives you the ability to relate governance budget to strategic goals, funded programs, current project and metrics. Think of it as the audit worksheets – no one ever sees those, and the auditor reports out only the results.

Original Post.

In my previous post I discussed some analytical phrases that are gaining traction. Related to that I have had a number of requests for the deck that I presented at the Enterprise Dataversity  – Data Strategy & Analytics Forum.  I have attached the presentation here. NOTE: This presentation was done a few years ago while I was with CMMI (Now ISACA) as a result it is tied to the Data Management Maturity Model. I talked about analytics, and my colleague on the talk addressed data maturity

Also, while I am posting useful things that people keep asking for, here are a set of links that Jeff Gentry did on management frameworks for a Dataversity Webinar. Of particular interest to me was the mapping of the Hoshin Strategic Planning Framework to the CMMI Data Management Maturity Framework. The last link is the actual excel spreadsheet template.

Links:

  1. Webinar Recording: CDO Webinar: CDO Interview with Jeff Gentry – Favorite Frameworks/. The link to the deck is here
  2. Link to Using Hoshin Frameworks. Hoshin is bigger than just this matrix, and is a heavy process for most people. However, the following gives you soem background: http://www.slideshare.net/Lightconsulting/hoshin-planning-presentation-7336617
  3. Hoshin Framework linked to DMM: Data Analytics Strategy and Roadmap Template 20160204D.xlsx

Forensic Analytics and the search for “robust” solutions

12 Jan

Happy New Year!

This entry has been sitting in my “to publish” file for some time. There is much more to be said on the topic. however, in the interest of getting it out … enjoy!

=======================================================

This entry was prompted by the article in the INFORMS ANALYTICS Magazine article titled Forensic Analytics: Adapting to a Growing Pandemic by Priti Ravi who is a senior manager with Mu Sigma and specializes “in providing analytics-driven advisory services to some of the largest retail, pharmaceutical and technology clients spread across the United States.”

Ms. Ravi writes a good article that left me hanging. Her conclusion was that the industry lacks access to sophisticated and intelligent monitoring equipment, and there exists a need for a “robust fraud management systems” that “offer a collective set of techniques” to implement a “complex adaptive approach.” I could not agree more. However, where are these systems? Perhaps even what are these systems?

Adaptive Approaches

To the last question first. What is a Complex Adaptive Approach? If you Google the phrase, the initial entries involve biology and ecosystems. However, wikipedia’s definition encompasses medicine, business and economics (amongst others) as areas of applicability. From an analytics perspective, I define complex adaptive challenges as those that  are impacted by the execution of the analytics – by doing the analysis, the observed behaviors change. This is inherently true of fraud as the moment perpetrators  understand (or believe) they can be detected, behavior will change. However, it also applies to a host of other type of challenges: criminal activity, regulatory compliance enforcement, national security; as well as things like consumer marketing and financial investment.

In an article titled Images & Video: Really Big Data the authors (Fritz Venter the director of technology at AYATA; and Andrew Stein the chief adviser at the Pervasive Strategy Group. define an approach they call “prescriptive analytics” that is ideally suited to adaptive challenges. They define prescriptive analytics as follows:

“Prescriptive analytics leverages the emergence of big data and computational and scientific advances in the fields of statistics, mathematics, operations research, business rules and machine learning. Prescriptive analytics is essentially this chain of transformations whereby structured and unstructured big data is processed through intermediate representations to create a set of prescriptions (suggested future actions). These actions are essentially changes (over a future time frame) to variables that influence metrics of interest to an enterprise, government or another institution.”

My less wordy definition:  adaptive approaches deliver a broad set of analytical capabilities that enables a diverse set of integrated techniques to be applied recursively.

What Does the Robust Solution Look Like?

Defining adaptive analytics this way, one can identify characteristics of the ideal “robust” solution as follows:

  • A solution that builds out a framework that supports the broad array of techniques required.
  • A solution that is able to deal with the the challenges of recursive processing. This is very data and systems intensive. Essentially for every observation evaluated, the system must determine whether or not the observation changes any PRIOR observation or assertion.
  • A solution that engages users and subject matter experts to effectively integrate business rules. In an environment where traditional predictive analytic models have a short shelf life (See Note 1), engaging with the user community is often the mechanism to quickly capture environmental changes. For example, in the banking world, tracking call center activity will often identify changes in fraud behavior faster than a neural network set of models. Engaging the User in the analytical process will require user interfaces, and data visualization approaches that are targeted at the user population, and integrate with the organization’s work processes. Visualization will engage non technical users to help them apply their experience and intuition to the data to expose insights. The census bureau has an interesting page, and if you look at Google Images, you can get an idea of visualization approaches.
  • A solution that provides native support for statistical and mathematical functions supporting activities associated with data mining : clustering, correlation, pattern discovery, outlier detection, etc.
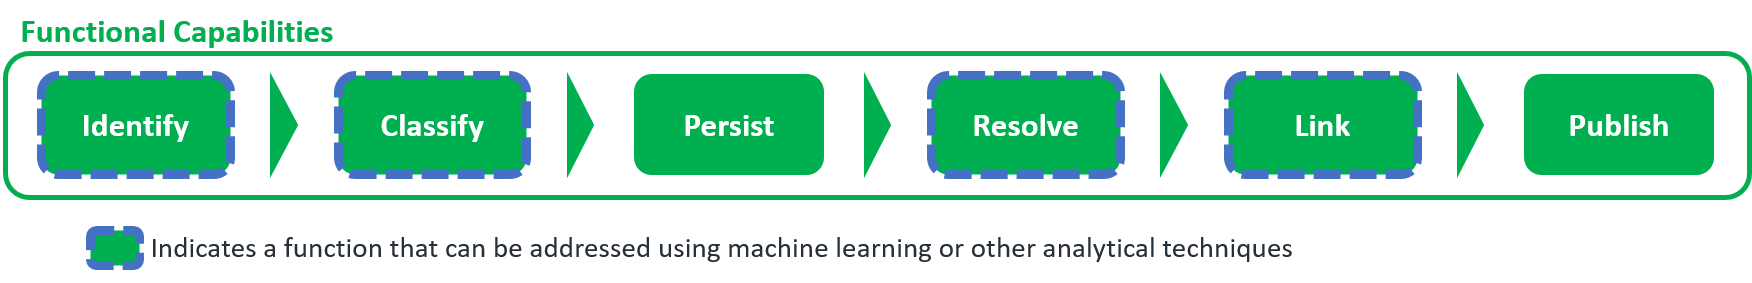
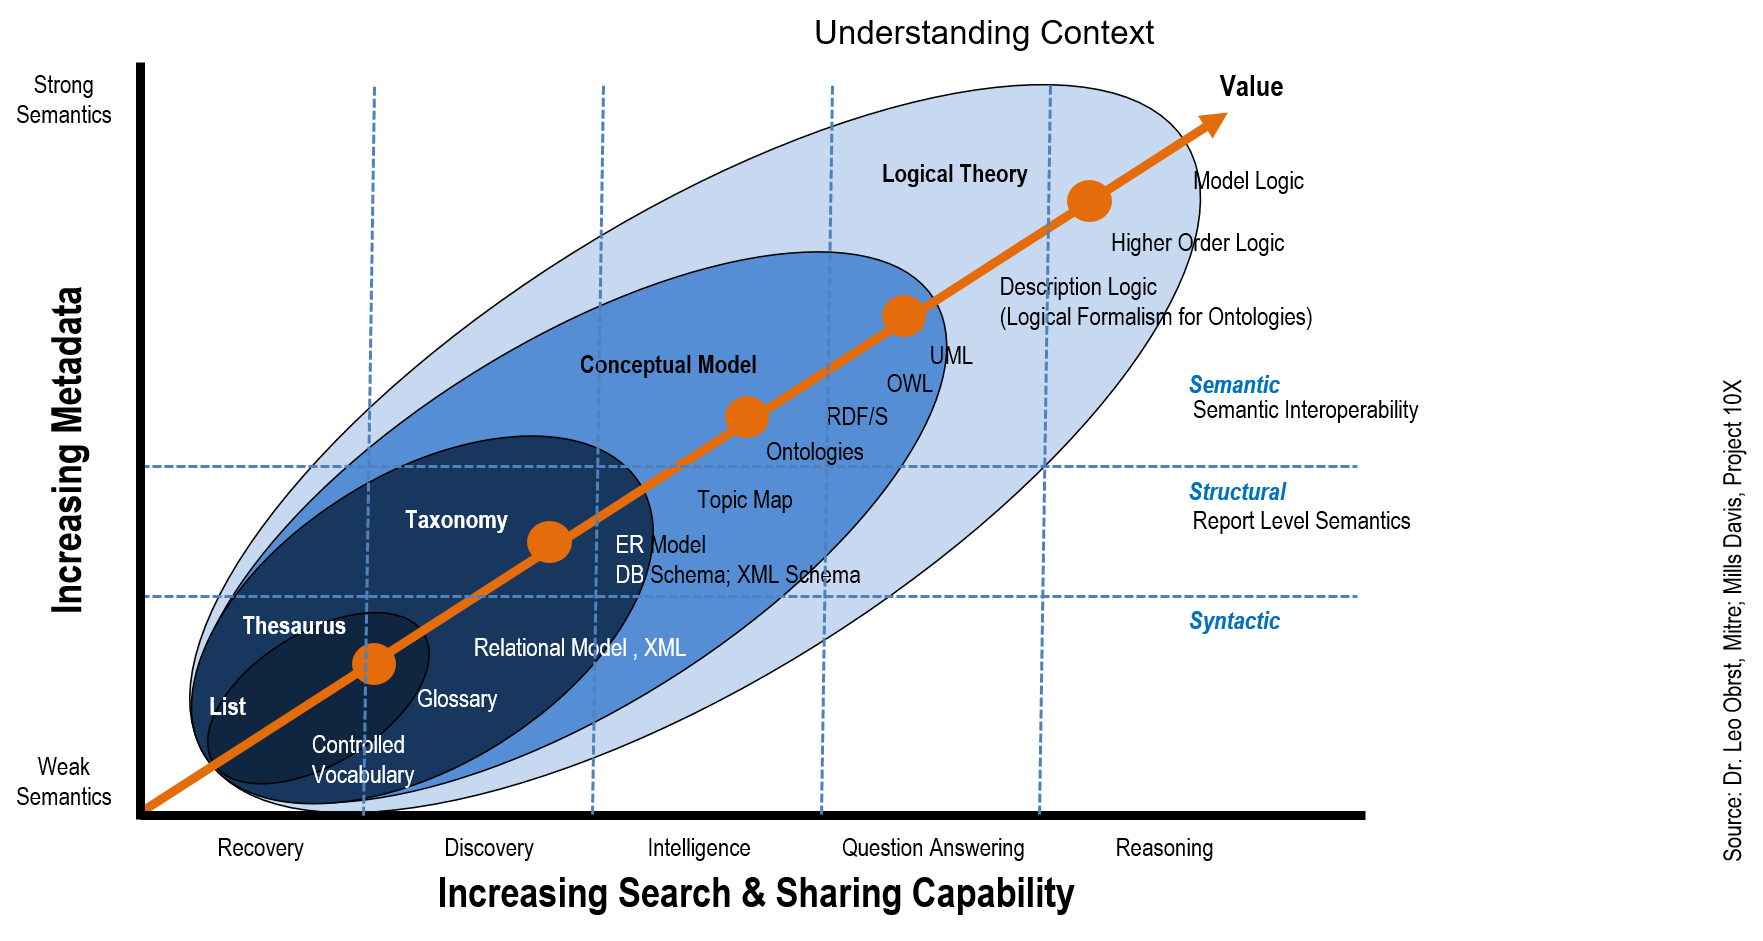
  • A solution that structures unstructured data: categorize, cluster, summarize, tag/extract. Of particular importance here is the ability to structure text or other unstructured data into taxonomies or ontologies related to the domain in question.
  • A solution that persists data with the rich set of metadata required to support complex analytics. While it is clearer why unstructured data must be organized into a taxonomy / ontology, this also applies to structured data. Organizing data consistently across the variety of sources allows non obvious relationships to be exposed, and application of more complex analytical approaches.
  • A solution that is relatively data agnostic  – data will come from many places and exist in many forms. The solution must manage the diversity and provide a flexible way to integrate new data into the analytical framework.

What are Candidate Tools ?

And now to the second question: where are these tools? It is hard to find tools that claim to be “adaptive analytic” tools; or “prescriptive analytics” tools or systems in the sense that I have described them above. I find it interesting that over the last five years, major vendors have subsumed complex analytical capabilities into a more easily understandable components. Specifically, you used to be able to find Microsoft  Analytical Services easily on their site. Now it is part of MS SQL Server as SSAS; much the same way that the reporting service is now part of the database offer as SSRS (reporting services). There was a time a few years ago when you had to look really hard on the MS site to find Analytical Services. Of course since then Microsoft has integrated various BI acquisitions into the offer and squared away their marketing communication. Now their positioning is squarely around  BI and the database. Both of these concepts are easier to sell at the executive level, than the notion of prescriptive or adaptive analytics.

The emergence of databases and appliances optimized around analytics has simplified the message on the data side. everyone knows they need a database, and now they have one for analytics. At the decision maker level, that is a much easier decision than trying to figure out what kind of analytical approach the organization is going to adopt. People like Teradata have always supported analytics through the integration of SAS and now R as in-database functionality. However, Greenplum, Neteeza and others have incorporated SAS and the open source analytical “R” . In addition, we have seen the emergence (not new but much more talked about it seems) of the columnar database. The one I hear about most is the Sybase IQ product; although there have been a number of posts on the topic on here, here, and here.

My point here is that vendors have too hard a time selling complex analytical solutions, and have subsumed the complex capabilities into the concepts that are easier to package, position and communicate around; namely; database products and Business Intelligence products. The following are product sets that are candidates for the integrated approach. We start with the big players first and work towards that are less obviously candidates.

SAS

The SAS Fraud Framework provides an integration of all the SAS components that required to implement a comprehensive analytics solution around adaptive challenges (all kinds of fraud, compliance, money laundering, etc. as examples). This is a comprehensive suite of capabilities that spans all activities: data capture, ingest, and quality; analytics tools (including algorithm libraries), data visualization and reporting / BI capabilities. Keep in mind that SAS is a company that sells the building blocks, and the Fraud Framework is just that, a framework within which customers can build out capabilities. This is not a simple plug and play implementation process. It takes time and investment and the right team within the organization. The training has improved, and it is now possible to get comprehensive training.

As with any implementation of SAS, this one comes with all the caveats associated with comprehensive enterprise systems that integrate  analytics into the fabric of an organization. The Gartner 2013 BI report indicates that SAS “very difficult to implement”. This theme echoes across the product set.  Having said that   when it comes to integrated analytic of the kind we have been discussing all, of the major vendors suffer from the same implementation challenges – although perhaps for different reasons.

Bottom line however, is that SAS is a company grounded in analytics – the Fraud Framework has everything needed to build out a first class system. However, the corporate culture builds products for hard core quants, and this is reflected in the Gartner comments.

IBM

IBM is another company that has the complete offer. They have invested heavily in the analytics space, and between their ETL tools; the database/ appliance and Big Data capabilities; the statistical product set that builds off SPSS; and, the Cognos BI suite users can build out the capabilities required. Although these products are being integrated into a seamless set of capabilities, they remain somewhat separate and this probably explains some of the implementation challenges reports. Also, the product side of the IBM operation does not necessarily speak with the Global Services side of the house.

I had thought when IBM purchased Systems Research & Development (SRD) in 2005 that they were going to build out capabilities that SRD and Jeff Jonas had developed. Jeff heads up the Entity Analytics group within IBM Research, and his blog is well worth the read. However, the above product set appears to have remained separated from the approaches and intellectual knowledge that came with SRD. This may be on purpose – from a marketing perspective, buy the product set, and then buy IBM services to operationalize the system is not a bad approach.

Regardless, as the saying goes, no one ever got fired for buying IBM” probably still holds true. However, like SAS beware of the implementation! Any one of the above products (SPSS, Cognos, and Infosphere) require attention when implementing. However, when integrating as an operational whole, project leadership needs to ensure that expectations as to the complexity and time frame are communicated.

Other Products

There are many other product sets and I look forward to learning more about them. Once I post this, someone is going to come back and mention “R” and other open source products. There are plenty out there. However, be aware that while the products may be robust, many are not delivered as an integrated package.

With respect to open source tools, it is worth noting that the capabilities inherent in Hadoop – and the related products, lend themselves to adaptive analytics in the sense that operators can consistently re-link and re-index on the fly without having to deal with where and how the data is persisted. This is key in areas like signals intelligence, unstructured data analysis, and even structured data analysis where the notion of semantic equivalence is shifting. This is a juicy topic all by itself and worthy of a whole blog entry.

Notes:

  1. Predictive analytics relies on past observations to predict future observations. In an adaptive environment, the inputs to those predictive models continually change as a result of the outputs using the past observations.

The merging of analytics and transactional data platforms requires more than just an upgrade in technology!

15 Sep

This IDC white paper puts the evolution of data platforms into layman’s terms. My take away is that the unshackling of information architects and applications from the constraints of the traditional RDBMS will continue. Many of the design choices that the article details are grounded in the historic limitations of the data platform. The comments made under the Future Outlook segment are key:

“Trying to make definitive statements about the state of analytic-transaction data platforms going forward is challenging, because both the database kernel technology and the hardware on which it runs are evolving at a rapid pace. In addition to this, new workloads and mounting performance requirements add even more to the pace of development. It is safe to say that all the technology described in this study, admittedly in a very abstract manner, may be described as transitional technology that is evolving quickly. New approaches to data structures, new optimizations for transactional data once it is fully freed from the constraints of disk optimization, new ways of organizing processors and memory, and the introduction of non-volatile dual in-line memory modules (NVDIMMs) all will no doubt result in technologies within 10 years that are very different from what is described here.

While platforms and technologies are evolving (this discussion has additional detail here), I find the juxtaposition of the “ideal” view presented here and the reality of most data operations interesting. This article provides “Essential Guidance” focused on IT buyers and guidance on choosing the right technology platform.

The focus on hardware and technology tends to obscure an equally important part of the buying equation – namely can managers manage these new technologies to achieve the desired business impacts and resulting business benefits. For the most part the answer is a resounding – NO. For these “next gen” implementations to work, organizations need to not only upgrade their platforms, but also their management practices. The balance of this blog entry examines some of the areas that the IDC article focuses on from the management perspective of the Chief Data Officer or Enterprise Information Architect.

The Enterprise Data Warehouse. Traditionally the Enterprise Data Warehouse (EDW) has been considered the repository of the “single version of the truth”. However, when it comes to analytics – and melding the transactional data store with analytics, this is a hard concept. There is no one version of the truth – everything is context driven. The design alternatives presented in the article (See Figure below) enable this in that they generally store both the transactional (source) and the fully resolved EDW version. This allows users to hit both the transactional store AND the EDW depending on the context they seek and how they want to interact with the data. Implicit in this view is that the context is captured and in a machine exploitable form that enables users to derive their own “single version of the truth”. This is a function of metadata discussed below. Additionally the article recognizes that the “one large database” solution is not generally a viable alternative; the issue being one of “manageability and agility.” This is somewhat contradicted in the opening “opinion” section in that they talk about a canonical data model. However, I am going to assume that the canonical recommendation is related to the metadata and not the content.

In all of the platform options discussed in the paper (see below), data managers need to keep track of a transactional data and data within a fully resolved EDW. The context and the semantic meaning of the content of both of those data sources needs to be managed, cross walked, and communicated to the user community. This will involve an evolution in both management practices and tools.

IDC Graphic on Data PLatforms

Metadata. I like the way this paper addresses metadata:

“Metadata, including all data models and schemas in the relevant databases or data collections, must be harmonized, kept current with those databases, and mapped to higher order constructs, including a business glossary and, for data managed in common, a canonical data model, in order to facilitate the access and management of the data.”

The notion of mapping “higher order constructs” is key. While it is not always possible or feasible to create a canonical data model, it is very feasible to create a canonical metadata model (metamodel). This give you a consistent way to fully describe your data regardless of the physical form it takes, and link it to higher order constructs referred to. My article here talks to the role the enterprise plays in managing the metadata at the enterprise level.

Managing the Evolution. The architectures discussed in the paper all require an evolution from the transactional data stores that exist today towards platforms that can respond to business needs rapidly, and with little or no latency. The “Type 5” platform in Figure 1 is the “Data Lake” that has become such a buzzword. In this configuration, there is a single data structure for both transactions and analytics. The ETL functions, number of indexes, and flexibility that can be applied to render the data all place a larger burden on the governance disciplines. Additionally, the process by which the organization integrates the business and IT activities requires formalizing in a way that breaks down the traditional silos.

Hampering the evolution at some level is the fact that the tool suites are not entirely intuitive. Tools to handle the mapping of the higher order constructs (concepts systems; ontologies; taxonomies, reference data…), and the management of multiple dictionaries cannot easily be implemented without complex configuration and often coding. The tool vendors seem to be coming along, but many are still working to apply governance and curation within the context of table based systems. The reality is that to create fully described data that is linked to higher order constructs, and to manage these relationships requires a collection of tools that must be configured to address your environment. It is not yet easy.

The Way Forward. Previously I have made the comment that the Information Architect, Enterprise Data Management Office, or CDO must initially focus on creating a tangible value proposition for the business side of the house. As long as data management is perceived as a function related to standards, governance and “protocol” it will be perceived as slowing down the business and getting in the way of achieving business goals. This article details a scoped down set of goals that lay the foundation for that initial value proposition. Once the enterprise data management function is able to make the case they actually improve business operations, and impact key success metrics (i.e. revenue), what next?

This is where all the articles regarding CDO’s seem to agree. The next step is all about outreach and engagement with the broader business community – potentially internal and external to the organization. My recommendation here is to perform this activity using a framework that ensures the discussions stay focused on goals, practices, and result in actionable, measurable and prioritized recommendations. The CMMI Data Management Maturity Model (DMM) is one such framework. I am biased, admittedly as I helped create it, but for an independent opinion Bob Lambert at CapTech wrote a review that speaks volumes. The framework is used to engage in a series of workshops. These workshops serve to identify a maturity level, but more importantly identify the business priorities and concerns as detailed by the workshop participants. This is critical as the resulting recommendations inherently have buy-in from across the organization.

Because the Data Management Model evaluates capabilities at the “practice” level (i.e. what people actually do), it inherently details the next steps in terms of recommendations; in other words – do not try to create a semantically equivalent data model across the whole organization if you cannot even do it for a business unit or a project! Additionally, the model recognizes the relationships between functions. The end result is a holistic and integrated set of guidance for the overall data management strategy and implementation roadmap.

Organizations seeking to upgrade their data platforms to more closely resemble the “Analytic Transactional data platform” that enables the real-time enterprise as discussed in the IDC white paper will have greater success more quickly if they evolve their data management practices at the same time.